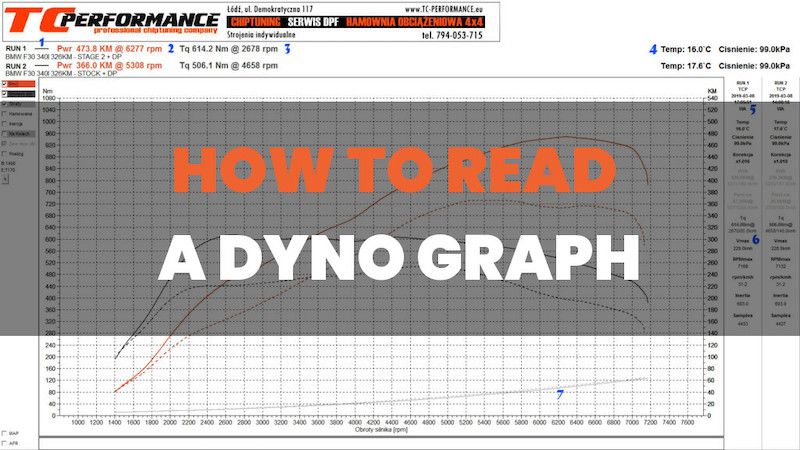
Often customers ask us what data they receive on the dyno graphs we present, and how they should be interpreted. So how to read a dyno graph and how to interpret it?
A dyno graph is constructed on the basis of two axes, horizontal – representing engine revolutions and vertical – referring to the parameters generated by the engine unit – engine’s horsepower and torque. Dyno charts are generated using a device called a dynamometer.
To correctly read the dyno graph we must recognize how many different measurements are on it. Most often, these are two results of the test on a dyno, the first is a measurement before modification, i.e. a serial car, and the second is a measurement after individual chip tuning.
Measurements indicated by the solid lines (also thicker) are the final results, i.e. final operation performed on the improved performance generated by the vehicle. The measurement marked with dashed lines (also thinner ones) is the initial or baseline measurement. If there are more measurements, they certainly have different thickness and colours, which makes it easier to distinguish.
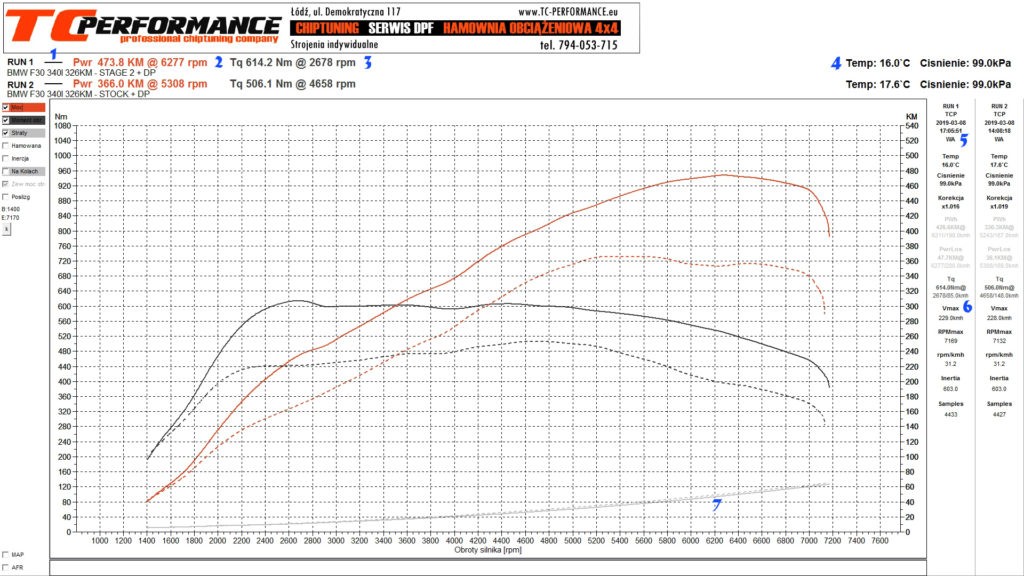
For example, the chart above shows two superimposed measurements of BMW 340i.
Starting from the upper left corner, under the logo of our company, we can see (1) RUN 1, meaning the first measurement. Then, after the dash, we see the maximum power (2) and the torque (3) along with the information at what engine speed has been obtained, after the symbol “@”. Below, we can see a text field that has an informative function about the range of modification, brand and model of the car being the subject of measurement and all other necessary side information. Similarly, we find RUN2, which is the measurement to which our modification is compared, also starts with the maximum parameters, and below them is a description of what this measurement concerns.
In the upper right corner (4) there is information expressed in units of the SI system referring to the atmospheric conditions prevailing at the time of measurement. These are air temperature and atmospheric pressure, respectively.
The right side of the graph shows detailed measurement data. One can find there, among others, the date of measurement (5) and the maximum speed achieved during the test on a given measuring gear(6). The selection of the optimal gear for the measurement consists of a number of different variables, such as the type of drive, power, number of gear ratios, or the length of gear ratios. Therefore, there are no rigidly set rules regarding the method of making a measurement test. For one car the optimal ratio will be 4 gear, for another 6. Directly under the information about the maximum vehicle speed, there is a data referring to the maximum engine speed.
In order to determine the exact power on the engine in the first place, we must measure the power generated directly on the wheels of the vehicle. The algorithm of the dynamometer taking into account the measurement of losses generated by the drivetrain system then converts the collected data to the final result. This allows to show the real engine power output. Losses in the vehicle’s drivetrain system increase with the speed of the car. The sum of the loss graph (7) and the power on the wheels creates the final result.
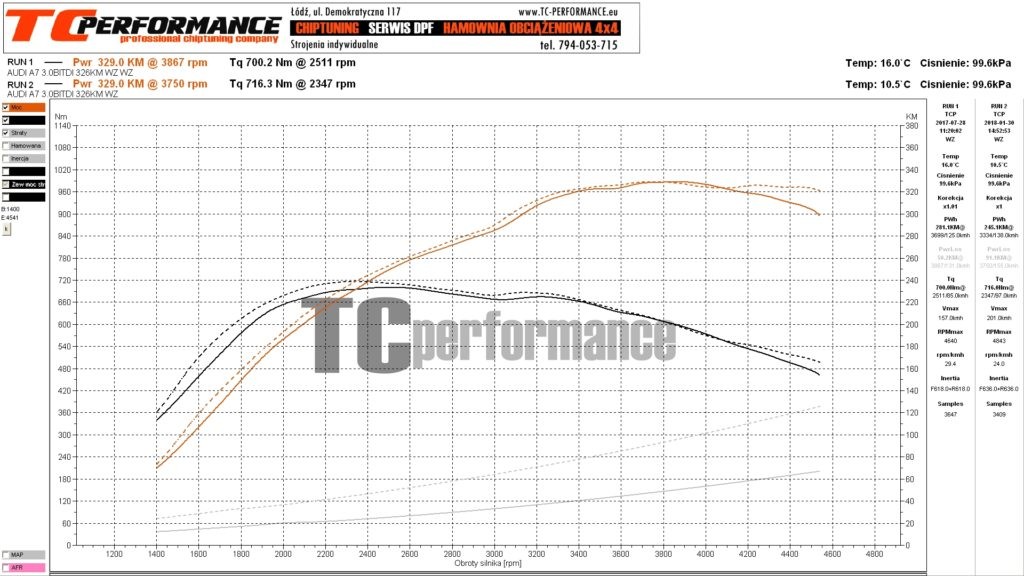
With a correctly made measurement, the value of the loss measurement does not affect the final result. An example of this is the above dyno graph of AUDI A6 3.0BITDI, where we performed the power measurement on two different gears. Despite the different loss values resulting from the measurement on two different gears, which translated into different maximum speeds, the final result remained unchanged. Thus, if the car does not have limited power in individual gears, the result of the measurement on the load dynamometer will not be different from the used gear. The merit of this is the use of electric brakes that adjust the load in a rotating system to the speed of the vehicle.
Imagine unleashing the hidden potential of your vehicle, experiencing a surge in power, improved fuel efficiency, and a thrilling driving...
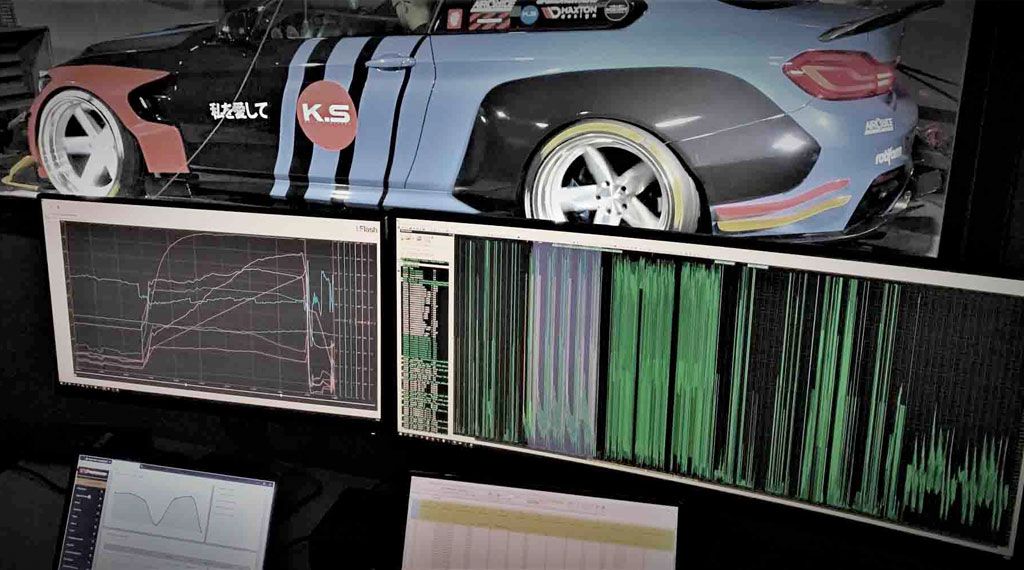
CHIPTUNING FILE BMW E92 335i 306HP - STAGE 2
Chiptuning Bmw E92 335i has been implemented in our company for a long time with various levels...
Tel: +44 7794234052
E-mail: info@tc-performance.com
* Normal landline and mobile phone charges apply

High quality, safe and dyno tested tuning files
Professional and fast support on every stage of work
Remapped files in reasonable price
Helpful & Friendly & Helpdesk
Automatic Invoicing from TC-PERFORMANCE LTD